
Systems Saturday 1: Why Latency Lies to You
The issue with average latency, how to measure latencies better, and how to design for a better user experience

In systems work, latency numbers get thrown around casually. Walk into any systems-focused developer’s office and you’ll hear it — “average latency is 120 ms,” “our SLA is under 200 ms,” “we’re p95 compliant.” But latency, when summarized poorly (which it often is), is a master of deception. Averages, in particular, tell you almost nothing about the actual performance your users experience.
Real-world systems, especially distributed ones, are messy. Requests contend for shared resources, networks introduce jitter, garbage collectors pause at inconvenient times, and a small percentage of slow requests can dominate the perceived performance. If you only measure and optimize for the average, you can ship a system that looks perfect on paper but feels drearily sluggish in reality.
In this post, we’ll go beyond the easy metrics. We’ll break down percentiles, explain why “tail latency” matters far more than most engineers expect, look at how distributed architectures amplify variability, and discuss practical strategies for designing and measuring systems that perform well for everyone, not just on average.
The Mirage of the “Average”
Let’s start with a thought experiment.
Imagine a restaurant where 90% of customers are seated instantly, and 10% wait 20 minutes. The average wait time might be under two minutes. Sounds great, right? But if you’re in that unlucky 10%, the experience is terrible, and that terrible experience is all you’ll remember.
The same trap happens in computer systems. Suppose a service handles a million requests:
900,000 finish in 50 ms
100,000 finish in 2 seconds
The average latency here is:
On paper, 245 ms looks “fast enough” for many SLAs. But in reality, 10% of users are seeing 2-second delays.
Why does this happen? Because averages collapse an entire distribution of latencies into a single number, erasing the outliers that often matter most. These outliers — the tails of the distribution — are where your reliability, user satisfaction, and even revenue can be won or lost.
The Percentiles: p50, p95, p99
Percentiles are the antidote to misleading averages. Instead of collapsing all requests into one number, they tell you how fast a given percentage of requests complete.
p50 (the median): 50% of requests complete in this time or less.
p95: 95% of requests complete in this time or less. The slowest 5% are excluded.
p99: 99% complete this fast. This leaves the slowest 1% out.
If you plot latency as a histogram, the p50 sits right in the middle, while p95 and p99 creep further toward the tail.

Example:
Suppose we measure request latencies and get this distribution:
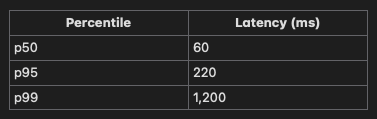
If you looked only at the p50 latency, you’d think the service is blazing fast. Most users finish in 60 ms. But the p99 tells you a different story: 1% of requests are taking 1.2 seconds, and those slow requests might be from your most valuable or high-throughput clients.
The higher the percentile, the more it reveals about rare, but often highly impactful delays. This is critical in distributed systems where even a small fraction of slow calls can drag down the entire user experience.
Why the Tail Latency Matters
In many systems, especially those with fan-out architectures, tail latency determines total latency.
Let’s say a web request hits a service that calls 10 backend microservices in parallel. Even if each backend is 95% fast, the math is brutal.
The probability that all 10 calls are in the “fast” bucket is:
That means in 40% of requests, at least one backend call will land in the slow tail. And since you can’t return to the user until the slowest call finishes, the tail latency of any dependency becomes the bottleneck.
At large scale, these tails are not just statistical noise. They are predictable, repeatable performance killers.
Google’s “The Tail at Scale” paper makes this point forcefully: as the number of parallel tasks increases, your overall response time approaches the worst-case behavior of your slowest component. That’s why companies like Google and Meta spend huge effort shaving milliseconds off p99s. Not because it makes graphs look good, but because p99 is the user experience.
Sources of Latency Lies
Tail latency is the result of a collection of rare-but-costly slowdowns that surface seemingly unpredictably. These issues often hide during small-scale tests, only to emerge in production when concurrency and data volumes are high.
Let’s break down some of the most common sources:
1. Network Availability and Jitter
Even in modern data centers with microsecond switch latencies, packets can be delayed or dropped. Common causes include:
TCP retransmissions due to packet loss.
Cross-traffic interference in shared network segments.
These slowdowns are sporadic but unavoidable. At scale, they often show up in the p99.
2. Contention for Shared Resources
When multiple requests compete for the same resource, the unlucky ones wait. For example:
CPU scheduling delays on oversubscribed machines.
Disk I/O contention for a popular dataset.
Lock contention on shared in-memory structures.
Even a microsecond-scale lock hold time can quickly become milliseconds at p99 when contention spikes.
3. Garbage Collection and Memory Pressure
In managed runtimes (e.g., Java, Go, .NET), garbage collection pauses can halt request processing. While average pause times may be small, large heaps or memory churn can trigger stop-the-world collections that hit your slowest percentiles.
4. Cache Misses
Caches flatten the latency curve beautifully — until they miss. A cold cache entry forces a fetch from slower storage layers (disk, network, or both). At p50, most requests may be cache hits, but p99 often includes those unlucky misses.
5. Cascading Slowdowns
One slow dependency can create a feedback loop:
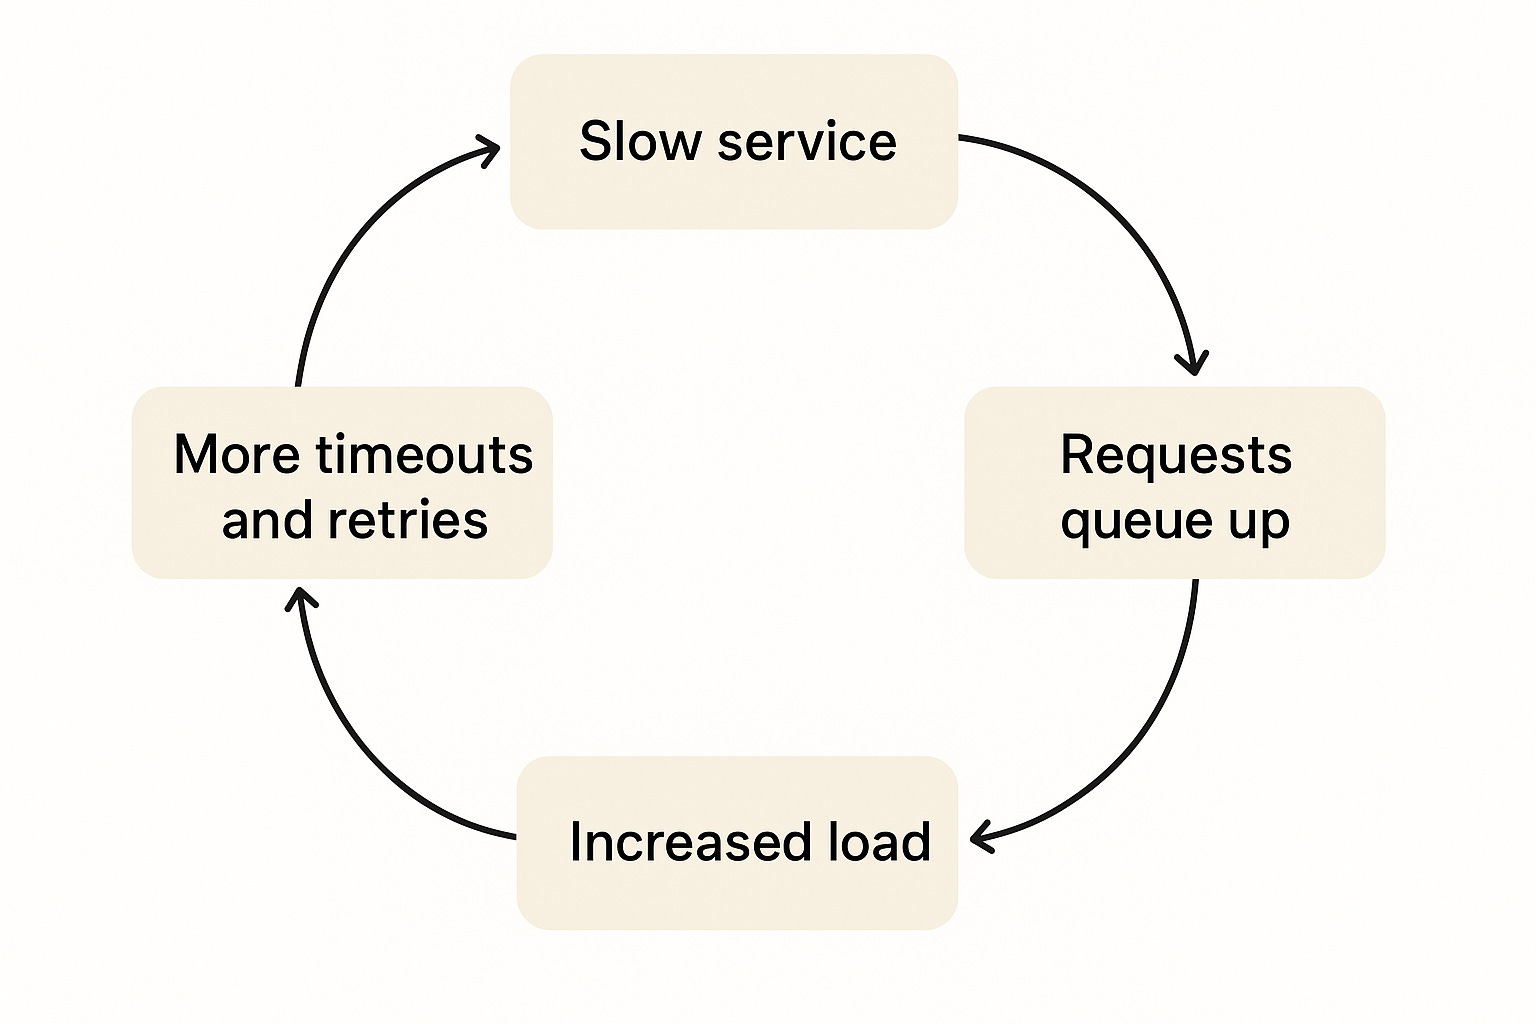
This is how a “rare” tail latency event in one microservice turns into a multi-service incident.
The key lesson here is tail latency comes from many small, intermittent problems, not one big bug. And because each source behaves differently, there’s no single fix. You need a toolkit of measurement and mitigation strategies.
In the next section, we’ll look at how these delays amplify in distributed systems, and why a “good enough” median latency is meaningless when your architecture fans out.
The Amplification Problem in Distributed Systems
In a single-process program, latency mostly depends on your own code’s execution speed and the hardware it runs on. In a distributed system, every hop from network, to storage, to dependent service adds its own variability. This variability doesn’t just add up; in many architectures, it multiplies.
1. Fan-Out Requests
The most common amplification pattern is fan-out:
A request arrives at Service A.
Service A calls multiple downstream services (B, C, D, etc.) in parallel.
The user’s response time is dictated by the slowest (rate-limiter) of those calls.
If Service B, C, and D each have a p95 latency of 200 ms, the end-to-end p95 of the whole request is worse than 200 ms, all because the slow tail of any dependency becomes your bottleneck.
For example:
95% of calls to each service are fast.
The probability that all 3 services are fast is:
\(0.95^3 = 0.857\approx 86\%\)This means ~14% of user requests will experience tail latency, even though each service looks healthy in isolation.
2. Serial Dependencies
Sometimes dependencies are called in sequence, not parallel. In this case, latencies add:
Service B takes 150 ms.
Service C takes 120 ms.
Service D takes 90 ms.
Even at median values, the end-to-end latency is:
At higher percentiles, these numbers can become hundreds of milliseconds worse.
3. Variability Compounding
Distributed requests can experience both additive and multiplicative effects:
Additive for serial chains.
Multiplicative for parallel fan-outs (probability math).
The result is that p50 latency is a poor predictor of real-world performance in a distributed system. What matters is how your p95, p99, and even p99.9 behave once you account for all the moving parts.
4. The Production Reality
At large-scale companies, engineers obsess over tails because they’re predictable pain:
More users → more concurrent requests → more probability that someone hits a slow path.
The larger the fan-out, the closer your “typical” request gets to worst-case latency.
It’s not uncommon for an architecture that looked fine with a 3-service fan-out in testing to grind under a 15-service fan-out in production, even when every individual service meets its SLA.
Measuring Latency the Right Way
If you want to reduce tail latency, the first step is to measure it accurately. This sounds obvious, but in practice many systems still rely on metrics that hide the very problems they’re trying to solve.
1. Avoid Averages in Dashboards
Averages compress the entire latency distribution into a single number and erase the tails entirely.
If your dashboard shows only “avg. latency = 180 ms,” you have no idea whether:
All requests are ~180 ms, or
90% are 50 ms and 10% are 2 seconds.
One hides a massive performance issue, the other doesn’t.
2. Track Percentiles
Every performance dashboard should display p50, p95, p99, and p99.9 (or some other assortment of tail latencies).
p50 shows typical performance.
p95 shows what most users see during good conditions.
p99 and above expose rare-but-impactful delays.
At scale, those “rare” delays happen constantly for someone.
3. Use Histograms, Not Just Gauges
A histogram tracks the full distribution of request times in buckets (e.g., 0–10 ms, 10–50 ms, 50–200 ms…). From histograms, you can compute any percentile after the fact and spot bimodal patterns. Patterns where most requests are fast, but a separate cluster is consistently slow.
An example text-based histogram could look as such:
Latency (ms) | Count
0–10         | ██████████████████████████████ (60%)
10–50        | ████████                       (20%)
50–200       | ████                           (10%)
200+         | ██                             (10%)
You immediately see a tail — something you’d miss if you only saw “average = 40 ms.”
4. Sample Carefully
In high-traffic systems, storing every request’s latency can be expensive, so teams often sample.
But beware:
If you sample too little, you’ll miss the rare events in the tail.
Tail latency analysis requires a bias toward capturing slow requests, not just a uniform sample.
5. Break Down by Context
Don’t just measure global latency; segment by:
Endpoint / query type.
Client region.
Backend dependency.
Request size / payload characteristics.
Often, tails are driven by a small subset of requests. Breaking down the data will help pinpoint the cause.
The goal is to make the invisible visible. When you start tracking latency distributions instead of averages, you stop being surprised by “random” performance issues because they stop being random in your eyes.
Designing for the Tail
You can’t eliminate tail latency entirely. Some requests will inherently always be slower than others. The goal is to reduce both the frequency and impact of those slow requests. This means designing systems with the tail in mind, not just the median.
1. Timeouts and Retries (with Care)
Timeouts prevent a slow dependency from blocking forever.
Retries can recover from transient issues — but they can also increase load and worsen the problem if misused.
Best practices:
Set tight timeouts for high-traffic fan-out calls (often <100 ms for internal RPCs).
Use exponential backoff to avoid retry storms.
Retry only idempotent requests.
2. Hedged Requests
A hedged request sends the same call to two replicas, slightly staggered in time.
If the first response comes quickly, cancel the second.
If the first is slow, the second may save you from a tail event.
Hedging trades extra load for lower p99 latency. Google’s “Tail at Scale” paper showed dramatic improvements in user-facing performance with this approach.
3. Load Shedding
When a service is overloaded, letting every request queue up ensures all of them are slow.
Load shedding drops some requests (ideally lower-priority ones) to keep the rest fast. Techniques include:
Dropping requests at the edge.
Serving stale cache results when possible.
Rejecting before expensive work starts.
4. Caching for Consistency
Caching isn’t just about speed. It’s about reducing variability. (Read this great post on caching being an abstraction, not an optimization)
A hot cache keeps most requests in the fast path, pushing tail events further out.
Even partial caching (e.g., caching only metadata) can smooth out performance.
5. Prioritization
Not all requests are equal. In high-load situations, prioritize:
Interactive requests over batch jobs.
Real-time queries over background sync.
This ensures tail events hit less-critical workloads first.
6. Architectural Changes
Sometimes the only real fix is a bigger design shift:
Reduce fan-out depth or breadth.
Decouple dependencies with asynchronous processing.
Co-locate frequently used services to reduce network hops.
These changes take more effort but can significantly improve p99 and p99.9 latencies.
The key is to treat tail latency as a first-class design target, not an afterthought. Median latency will improve almost automatically when you design for the worst cases, but the reverse is never true.
Closing Thoughts
In systems work, it’s easy to be lulled into a false sense of security by “good” averages. But users don’t experience averages. They experience individual requests, and the slowest ones are often the ones they remember.
“The thing I have noticed is that when the anecdotes and the data disagree, the anecdotes are usually right. There is something wrong with the way that you are measuring it”
- Jeff Bezos
At small scale, tail events can seem rare. At large scale, they’re inevitable. The more requests you serve, the more likely it is that someone is hitting the slow path at any given moment. In architectures with fan-out, that “someone” might be almost everyone.
The solution isn’t to ignore the tail but to make it a design target. Measure percentiles, track distributions, understand the sources of variability, and apply strategies that reduce both the frequency and impact of slow requests.
If you do this, you’ll stop shipping systems that look good in dashboards but feel slow in production. You’ll start building systems that are truly fast — not just for the median request, but for the ones at the very edge of the curve.
Because in the end, the p99 is the user experience.